Introduction
This time, I would like to consider the regional bias of grid storage plants and output control and their relationship (I'm sure there are many people who are not interested in this at all, but I was curious...)
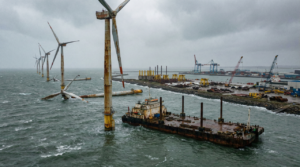
As the introduction of renewable energy expands in Japan, the introduction of grid-connected storage batteries and power storage stations (hereinafter simply referred to as "storage batteries") to smooth out output fluctuations is accelerating.
However, while advising each company, we had the feeling that the installation locations were concentrated in certain areas, and that output control (reduced renewable energy output) was also concentrated in the same areas.
Therefore, this time, I would like to organize the battery capacity, output control rate, and number of days by region based on publicly available information, and statistically verify the correlation between the two.
However, the data used this time was compiled based on published materials such as those from the Agency for Natural Resources and Energy and those from OCCTO (Organization for Cross-regional Coordination of Transmission Operators).
Please keep in mind that the figures do not necessarily represent completely accurate figures, for example, the information used for comparison is not necessarily from the same time point, and, as described below, the information on battery capacity is not for connected batteries. However, please keep in mind that the main purpose of this figure is to give you a rough grasp of the rough relationship between battery capacity and output control in each region (I apologize if the figures are incorrect. I apologize in advance...and if you find any mistakes, I would appreciate it if you could point them out).
(I'll tell you in advance that I would have liked to come up with something interesting, but I couldn't gather the materials properly, so the project fell through...)
Background — Measures to promote the introduction of storage batteries and output control issues
With the rapid spread of renewable energy, the introduction of large-scale grid storage batteries to level out output fluctuations in various regions has become an urgent issue.
To address these needs, the Ministry of Economy, Trade and Industry (METI) will implement subsidy projects totaling tens of billions of yen through the Sustainable Sustainable Creation Initiative (SII) from FY2022 onwards to support part of the installation and operation costs of energy storage systems that contribute to the equalization of renewable energy sources, primarily solar and wind power.
The number of grants approved nationwide from 2023 to 2025 will exceed 40, and the total amount of subsidies provided will reach approximately 60 billion yen in total.
Kyushu in particular is a major base that accounts for approximately 25% of the total amount of solar power generation facilities installed in the country, and ensuring the ability to adjust supply and demand to curb the excess electricity that occurs during times of peak solar radiation is an urgent issue.
As a result, many large-scale energy storage projects for Kyushu have been selected for SII subsidized projects, accounting for approximately 30% of the total.
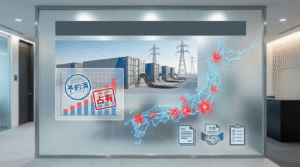
On the other hand, according to output control verification documents published by OCCTO, it has become clear that in the Kyushu, Chugoku, and Shikoku areas, renewable energy output curtailment will occur on the scale of several hundred GWh per year in fiscal year 2024, and that these regions will bear a particularly high curtailment burden.
This situation indicates the urgency and policy priority of introducing storage batteries to curb the suppression of renewable energy output.
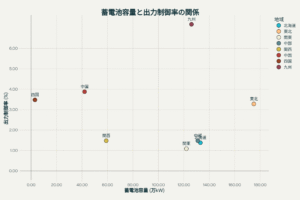
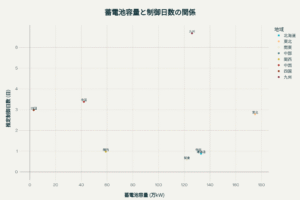
Regional distribution of battery capacity andRegional distribution of output control power amount
We were unable to find any information on the regional distribution of grid-connected battery capacity.
However, the document " Towards rapid grid connection of grid-use storage batteries " dated March 17, 2025 from the Agency for Natural Resources and Energy contained information on the capacity of storage batteries for which connection contracts have already been concluded, so I would like to use this information.
Regarding output control, the output control rate and estimated number of control days were quoted from the OCCTO website .
| region | Battery capacity (10,000 kW) | Output control rate (%) | Estimated days of control (days) |
|---|---|---|---|
| Hokkaido | 133 | 0.30 | 2 |
| northeast | 175 | 2.20 | 15 |
| Kanto | 122 | 0.009 | 0 |
| Central | 131 | 0.40 | 3 |
| Kansai | 59 | 0.40 | 3 |
| China | 42 | 2.80 | 20 |
| Shikoku | 3 | 2.40 | 18 |
| Kyushu | 126 | 6.10 | 45 |
The table shows that the output control rate in Kyushu Electric Power's service area is particularly high.
We can also see that the number of days of output control is also the highest.
Correlation analysis
At first glance, there doesn't seem to be much of a correlation, but I'll continue to look into it for now.
The relationship between battery capacity (10,000 kW) and output control rate (%) is as follows:
The relationship between battery capacity (10,000 kW) and estimated number of control days (days) is as follows:
The Pearson and Spearman correlation coefficients are:
The result was that the correlation was low.
Correlation between battery capacity and output control rate
Pearson correlation coefficient: -0.0593 (p-value: 0.8890)
Spearman correlation coefficient: -0.2994 (p-value: 0.4713)
Strength of correlation: Very weak Statistical significance: Non-significant (p-value > 0.05)
Linear regression equation: Output regulation rate = 2.0345 – 0.002108 × Battery capacity Determination coefficient (R²): 0.0035
Correlation between battery capacity and estimated number of days of control
Pearson correlation coefficient: -0.0749 (p-value: 0.8601)
Spearman correlation coefficient: -0.2994 (p-value: 0.4713)
Strength of correlation: Very weak Statistical significance: Non-significant (p-value > 0.05)
Linear regression equation: Estimated control days = 15.1858 – 0.019578 × battery capacity Coefficient of determination (R²): 0.0056
interpretation
In this analysis, we were unable to find any batteries with connected capacity, so "Capacity for which grid connection contracts have been signed"
We adopted the information from
This does not match operational statistics, as it includes a value greater than the number of batteries that are actually in operation.
In particular, in the Kyushu area, in response to the frequent occurrence of output curtailment, operators are proactively entering into additional battery connection contracts in order to stabilize the grid.It is thought that...
For this reason, it is important to note that Kyushu's capacity figure (1.26 million kW) does not represent the "storage capacity that is already contributing to the grid," but rather represents the " potential adjustment capacity that is expected to begin operation in the near future ."
Considering this perspective, the weak statistical negative correlation between battery capacity and output control may suggest the possibility that a reversal of causality (restriction ⇒ increase in contracts) is occurring in some areas (particularly Kyushu).
In other words, the increase in battery connection contracts is due to a high level of constraints, but we are not yet at a stage where we can say with certainty that an increase in batteries has reduced constraints.
From the above,The amount of storage batteries installed alone does not fully explain the curbing situation.
The point remains the same, but the reason for this may also be due to the "quality of capacity (operating status)" and "timing of implementation (contract stage vs. operational stage)".
In order to consider this more accurately, it seems necessary to use the capacity of storage batteries that are already connected to the grid and to track the pace of increase in storage battery capacity and the changes in the amount of suppression over time.
summary
Perhaps the materials used were not appropriate, but in this case, no significant correlation was found between the battery connection contract capacity and the actual renewable energy output control amount or number of days.
If I can find any information on connected batteries in the future, I would like to re-examine the correlation.
As explained in the interpretation section above, it is thought that output curtailment is occurring and that the number of connection contracts is increasing in preparation for this, so it is expected that the number of battery storage projects within Kyushu Electric Power's service area will increase, the projects will become more popular, and they will become more difficult to acquire.
We hope that business operators will refer to the above points when acquiring projects.


comment